### Libraries
library (ggplot2)
Warning: package 'ggplot2' was built under R version 4.5.2library (dplyr)
Adjuntando el paquete: 'dplyr'The following objects are masked from 'package:stats':
filter, lagThe following objects are masked from 'package:base':
intersect, setdiff, setequal, unionlibrary (lubridate)
Adjuntando el paquete: 'lubridate'The following objects are masked from 'package:base':
date, intersect, setdiff, unionlibrary (scales)
library (tidyverse)Warning: package 'tidyr' was built under R version 4.5.2Warning: package 'stringr' was built under R version 4.5.2── Attaching core tidyverse packages ──────────────────────── tidyverse 2.0.0 ──
✔ forcats 1.0.1 ✔ stringr 1.6.0
✔ purrr 1.1.0 ✔ tibble 3.3.0
✔ readr 2.1.5 ✔ tidyr 1.3.1── Conflicts ────────────────────────────────────────── tidyverse_conflicts() ──
✖ readr::col_factor() masks scales::col_factor()
✖ purrr::discard() masks scales::discard()
✖ dplyr::filter() masks stats::filter()
✖ dplyr::lag() masks stats::lag()
ℹ Use the conflicted package (<http://conflicted.r-lib.org/>) to force all conflicts to become errorsowidall <- read.csv("https://raw.githubusercontent.com/owid/covid-19-data/refs/heads/master/public/data/owid-covid-data.csv")
## Deselect cases/rows with OWID
owidall <- owidall[!grepl("^OWID", owidall$iso_code), ]
# Subset by continent: Europe
owideu <- subset(owidall, continent == "Europe")
# Make sure the date column is in Date format
owideu$date <- as.Date(owideu$date)
# Filter out 0 Deaths
# Outliers
#outliers <- outliers %>%
#group_by(location, year) %>%
#filter ((location=="Spain" & year == "2020" & ))
#labeling
countries <- c("Germany", "Ukraine", "Spain")
#Create the base ggplot
#ggplot () +
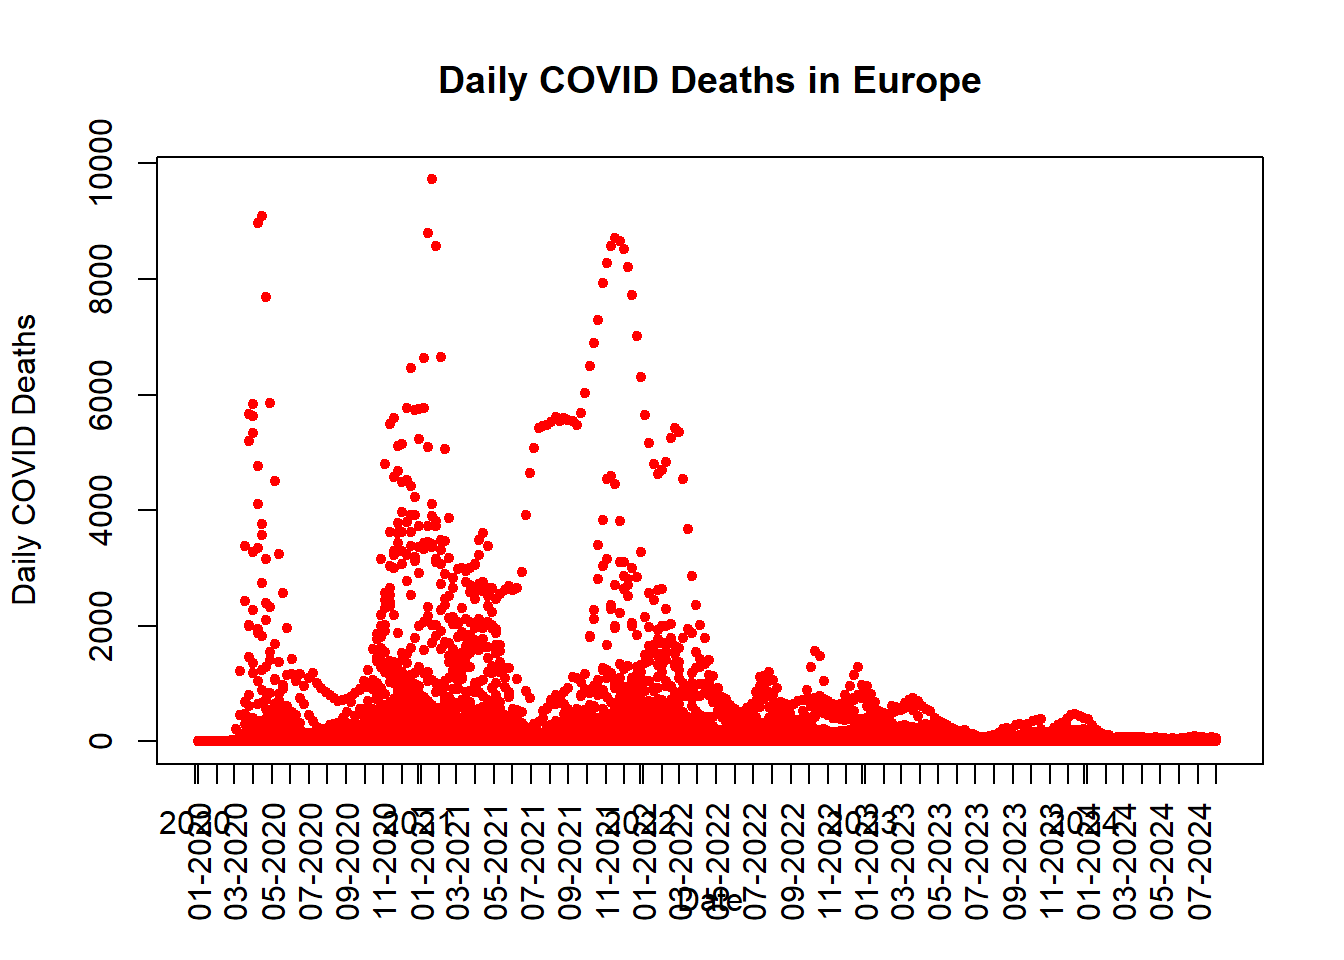
# Scatterplot: Daily COVID deaths in Europe
plot(
owideu$date,
owideu$new_deaths,
xlab = "Date",
ylab = "Daily COVID Deaths",
main = "Daily COVID Deaths in Europe",
pch = 20, # small diamonds to make a crisp plot.
col = "red",
family = "sans" # set to sans.
)
# Custom x-axis: month-year
axis(
1,
at = seq(min(owideu$date), max(owideu$date), by = "1 month"),
labels = format(seq(min(owideu$date), max(owideu$date), by = "1 month"), "%m-%Y"),
las = 2 # rotate labels vertically
)
scale_y_continuous(breaks = c (0, 1000, 2000, 3000, 4000, 5000, 6000, 7000, 8000, 9000, 10000), limits =c (0, 10000),
                   labels = c(0, 1000, 2000, 3000, 4000, 5000, 6000, 7000, 8000, 9000, 10000))
<ScaleContinuousPosition>
Range:
Limits: 0 -- 1e+04